The Mandelbrot set is one of those pieces of math that somehow finds itself into the public consciousness, the quintessential example of a fractal. Very informally, it's the set of complex numbers \(c\) for which the function \(f(z) = z^2 + c\) doesn't diverge when iterated to infinity.
Renders of the set show an infinitely complex boundary that appears recursive and extremely detailed. You may also be familiar with "zooms" of the Mandelbrot set that showcase this recursive nature:


In this post I attempt to render the Buddhabrot, a related fractal spawned from the points that do diverge.
Where's the Buddha?
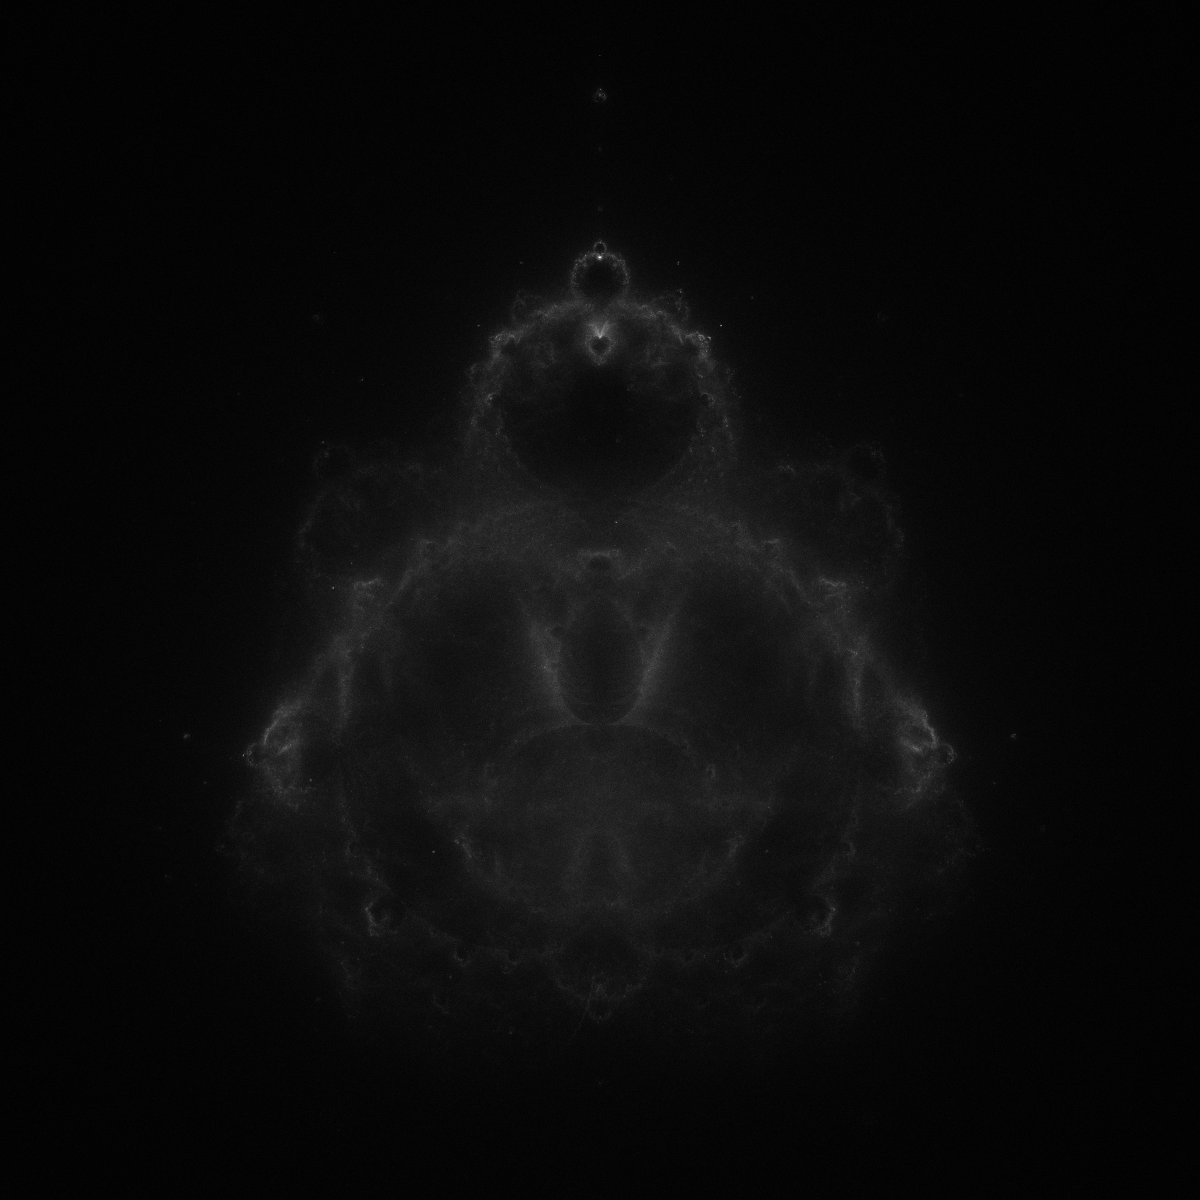
In short, the Buddhabrot is a probability distribution over the paths of points that diverge in the Mandelbrot fractal. In other words, we look at each point that escapes in the Mandelbrot fractal and track each point it passes through on its journey to divergence. This essentially creates a heatmap of the most commonly-visited spots as points travel off to infinity. Here's what it looks like:
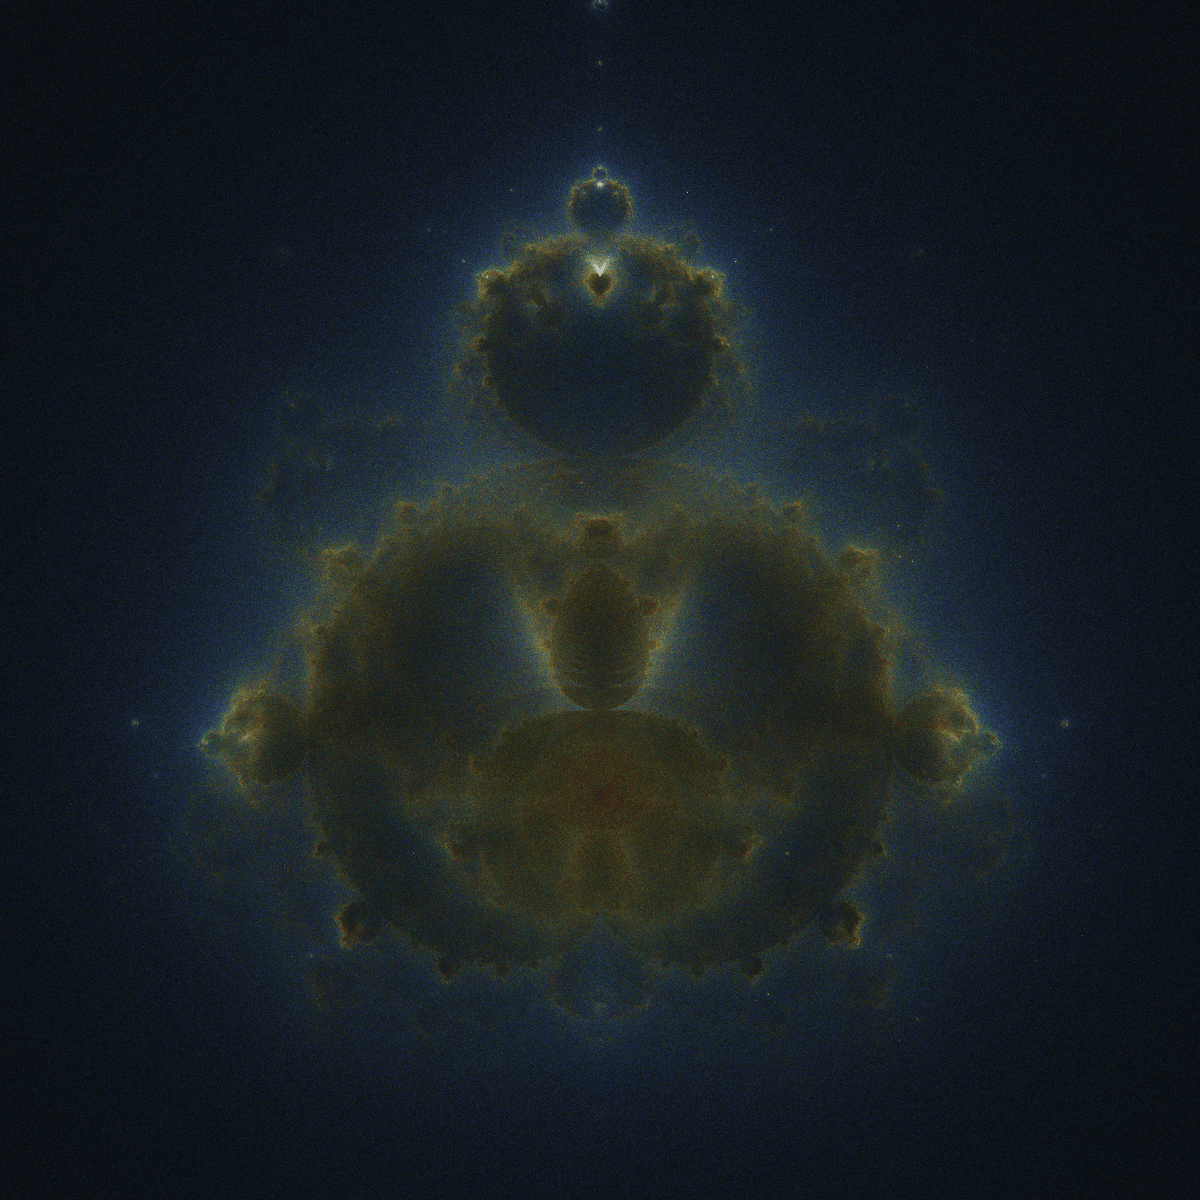
Wow! The image is still fractal in nature but with a ghostly, almost outer-space-like element to it. In this way we can really see the fractal's namesake -- the Buddha sitting in meditation pose.
Okay I'm actually lying to you. The picture above isn't the real Buddhabrot. The real image is just black-and-white and can look completely different based on the parameters you chose. I'll show you the rendering process involved in creating the final image.
The Rendering Process
The logic behind rendering a Buddhabrot image is pretty simple. First we create 2D image buffer with dimensions
WIDTH \(\times\) HEIGHT. Each pixel \((i, j)\) for \(i = 1, \ldots , m\) and \(j = 1, \ldots , n\) corresponds to the complex number
\(c = \frac{\mathrm{WIDTH}}{m} + \frac{\mathrm{HEIGHT}}{n} i\).
Each pixel has an associated counter that starts at 0. We sample SAMPLES random points (in our case 16,000,000) and iterate them
through the Mandelbrot function \(f(z) = z^2 + c\). For points that escape within a certain number of MAX_ITERATIONS, increment the counters
of all pixels passed through during that process. Discard points that don't escape with this process.
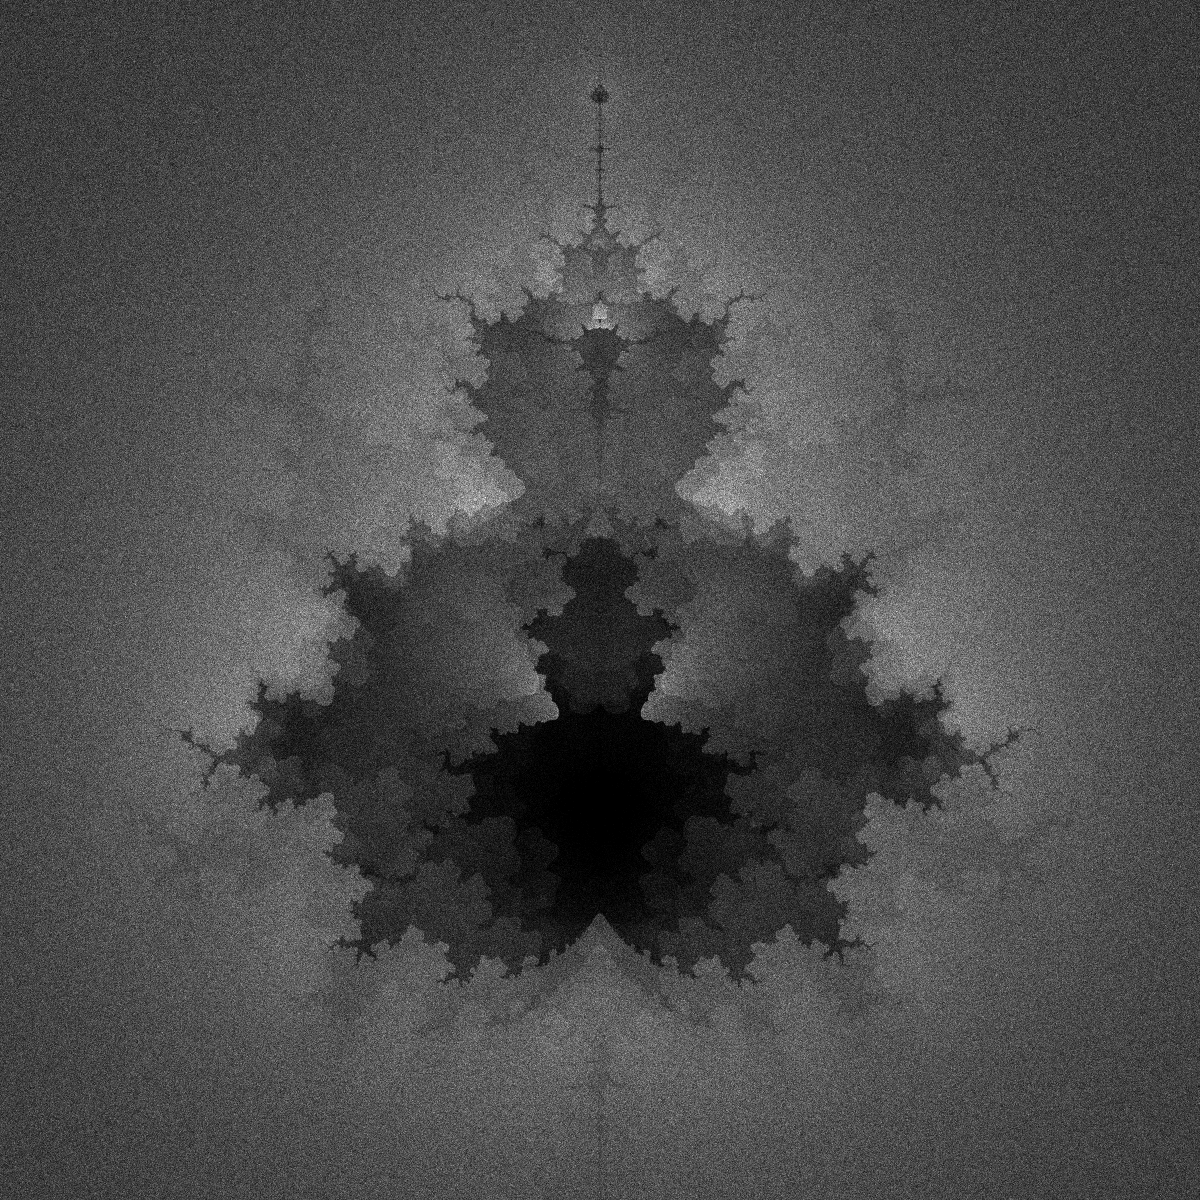
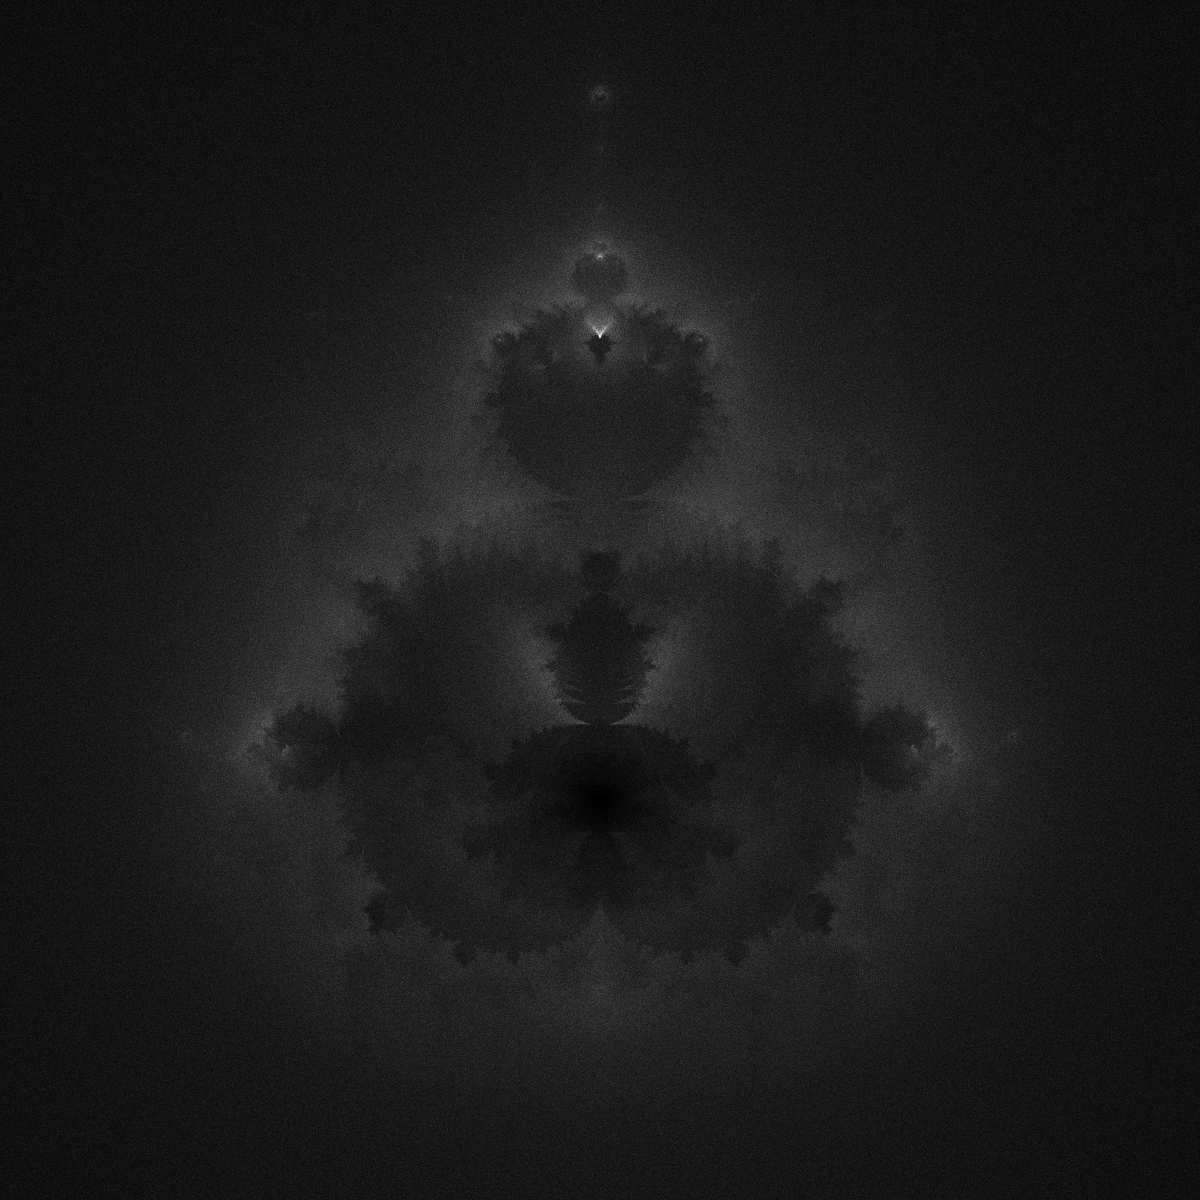
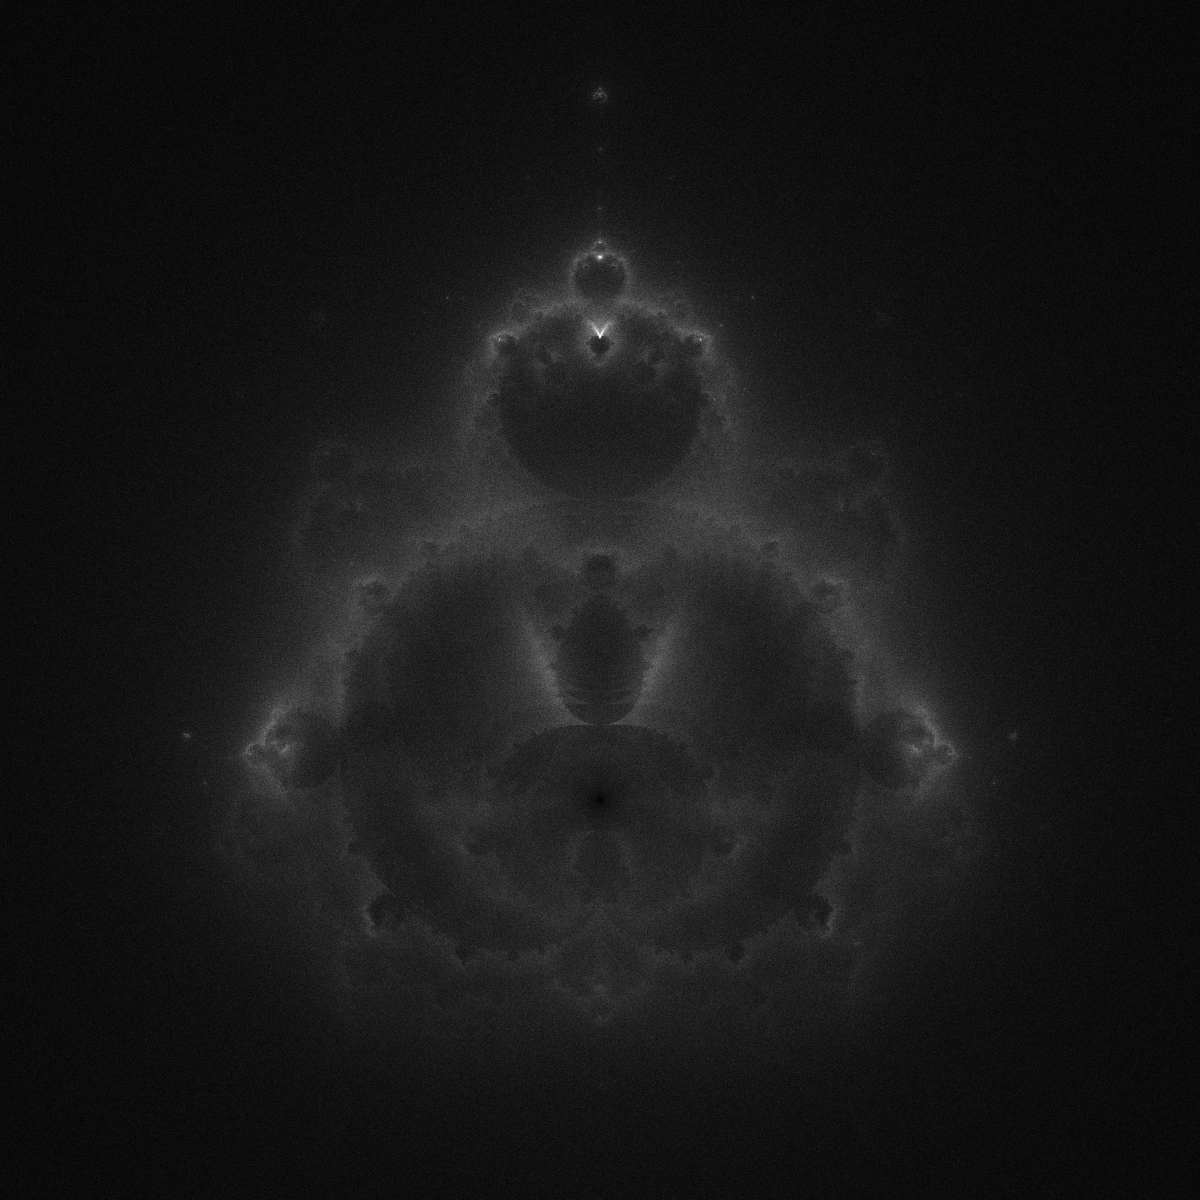
In the end we have a histogram showing the likelihood that escaped points pass these given pixels. The final step is to color each pixel in the output image a certain grayscale value based on the normalized range of all pixel counter values.
What we end up with is an image like so:
Great! But these images are still in black-and-white. In the following section, I borrow a technique from astronomy to breathe life into these pictures.
Pseudocolor
Pseudocolor techniques map intensity values to colors in grayscale images. If you're wondering why the first Buddhabrot image looks like some sort of nebula, it's because the same technique is used in astronomy to map non-visible light wavelengths to visible ones (colors).
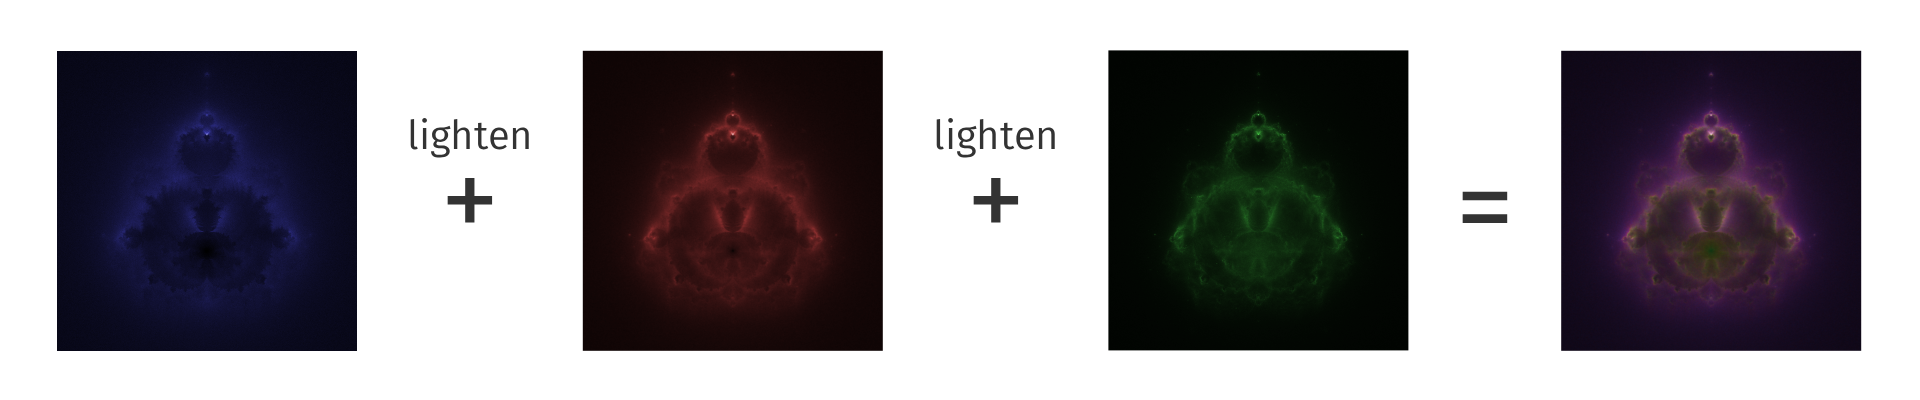
In our case, we can change the value of MAX_ITERATIONS and map each output image to a specific color. Then, we layer the images on top of each other with the correct blending mode to
produce the final colorized image:
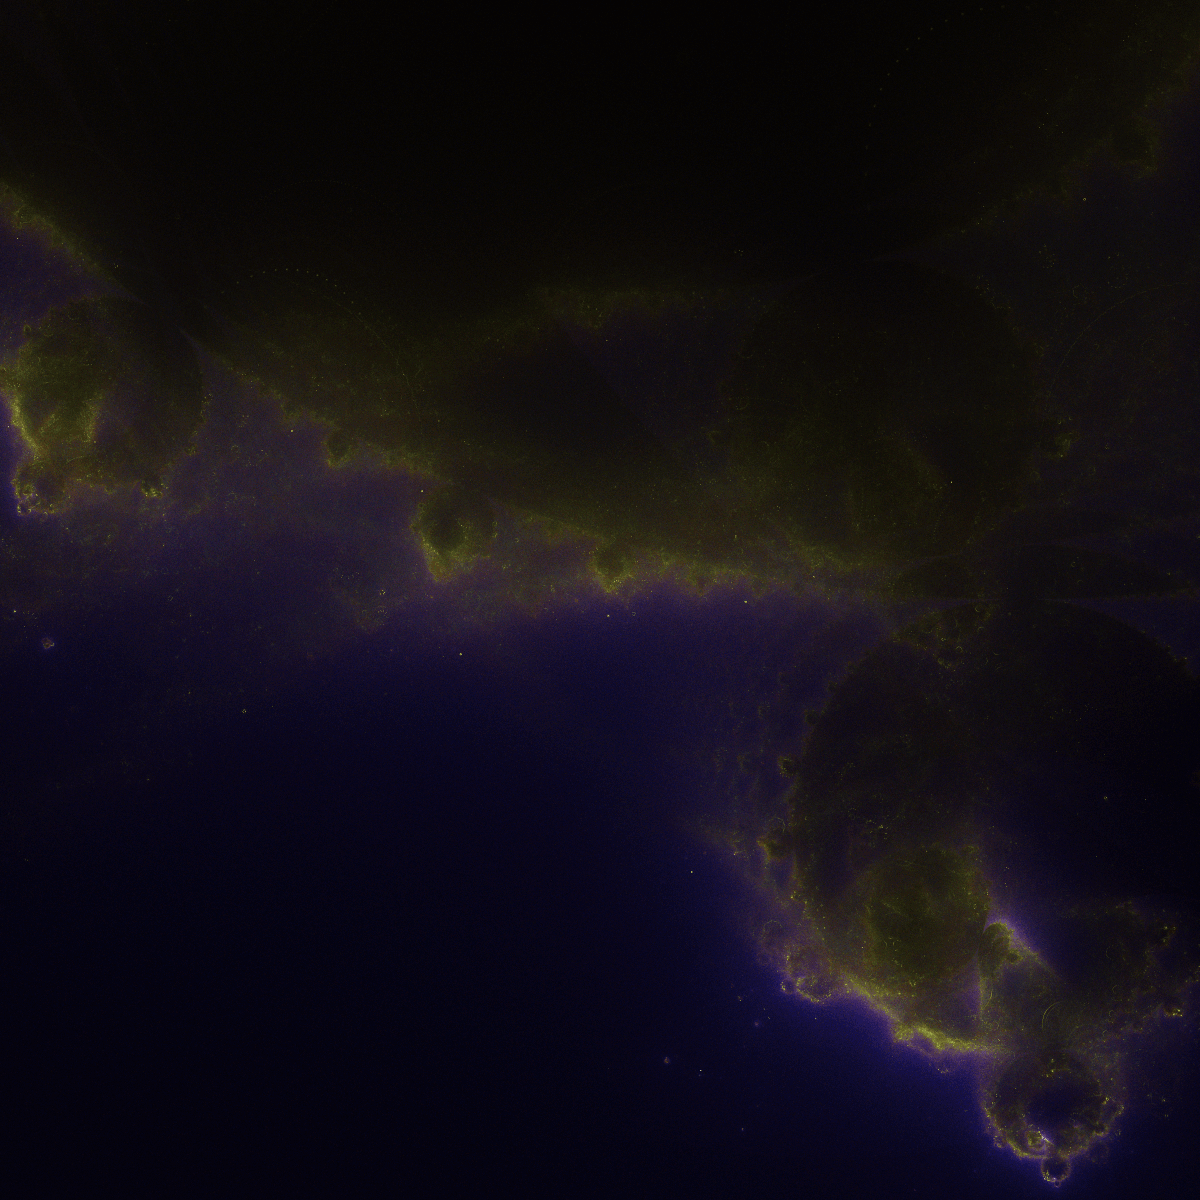
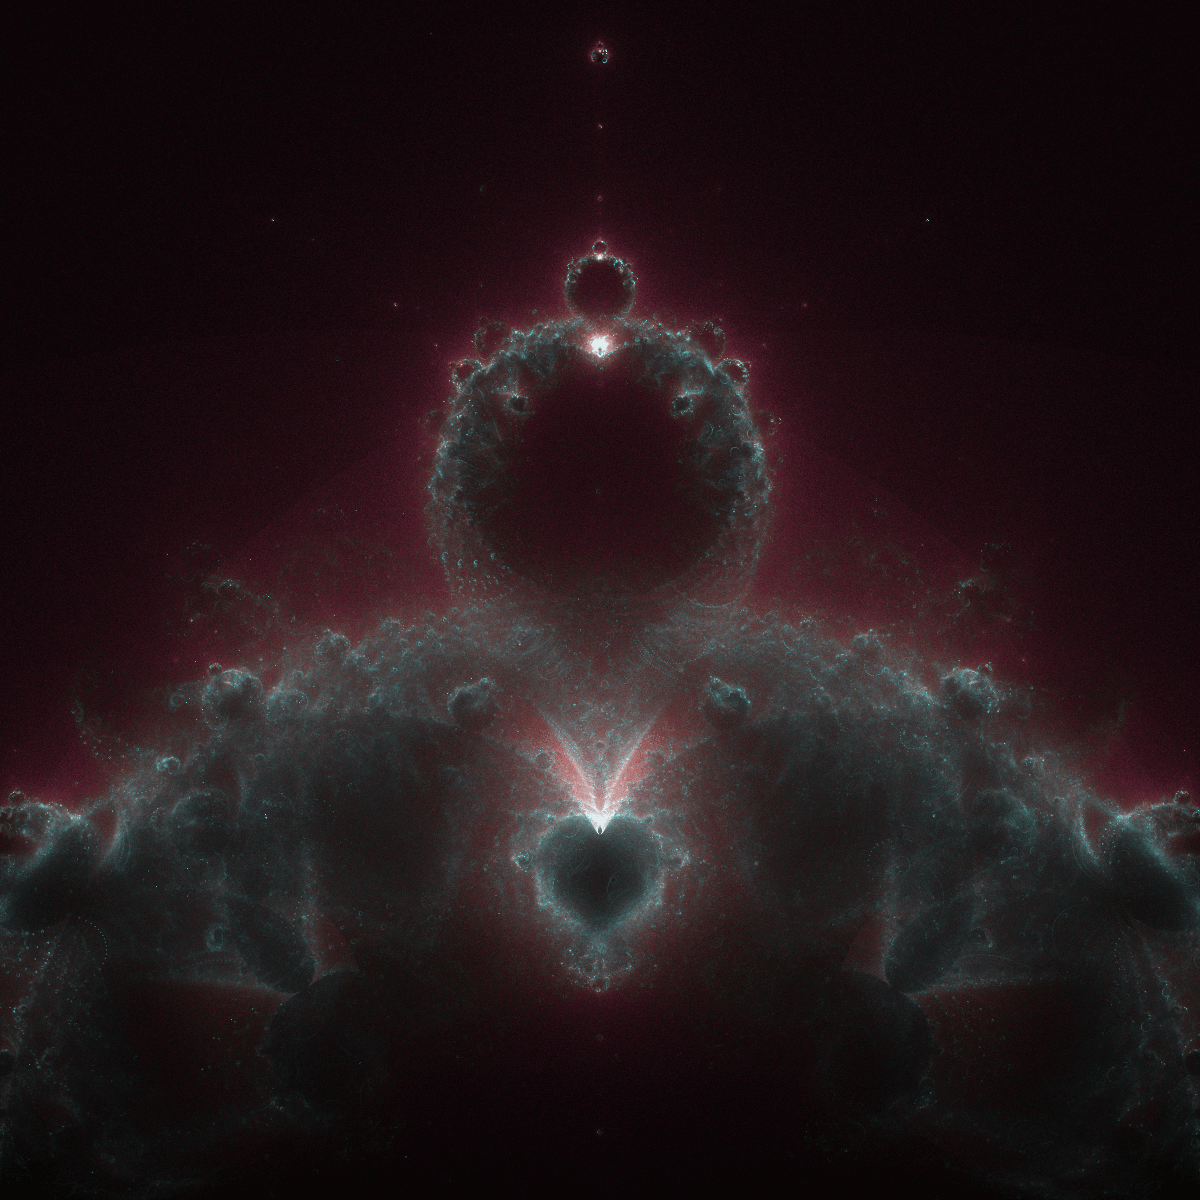
Below are a few examples of zoomed-in pseudocolor Buddhabrots:
Towards Nirvana
The goal of this experiment was to create some neat visualizations using Rust and learn a thing or two along the way. While I was able to significantly decrease rendering times by parallelizing with rayon, the computation remains solely on the CPU. Perhaps one day I'll revisit the Buddha on the GPU, similar to this project. Furthermore, I'd love to approach the rendering process through a probabilistic lens by leveraging the Metropolis-Hastings Algorithm.